Kupboard Console
The Kupboard Console is a web-based console that allows you to use kupboard using a web browser. Users can use CLI commands of kupboard to build a cloud native environments and deploy a variety of packages and applications. The Kupboard Console allows you to execute various tasks through the web UI without running many CLI commands directly from the terminal.
How to run Kupboard Console#
The Kupboard Console can be run in a localhost environment using the commands below, and you can access the console with localhost:8080 through a browser.
note
The Kupboard Console must be run in the same localhost environment as the browser.
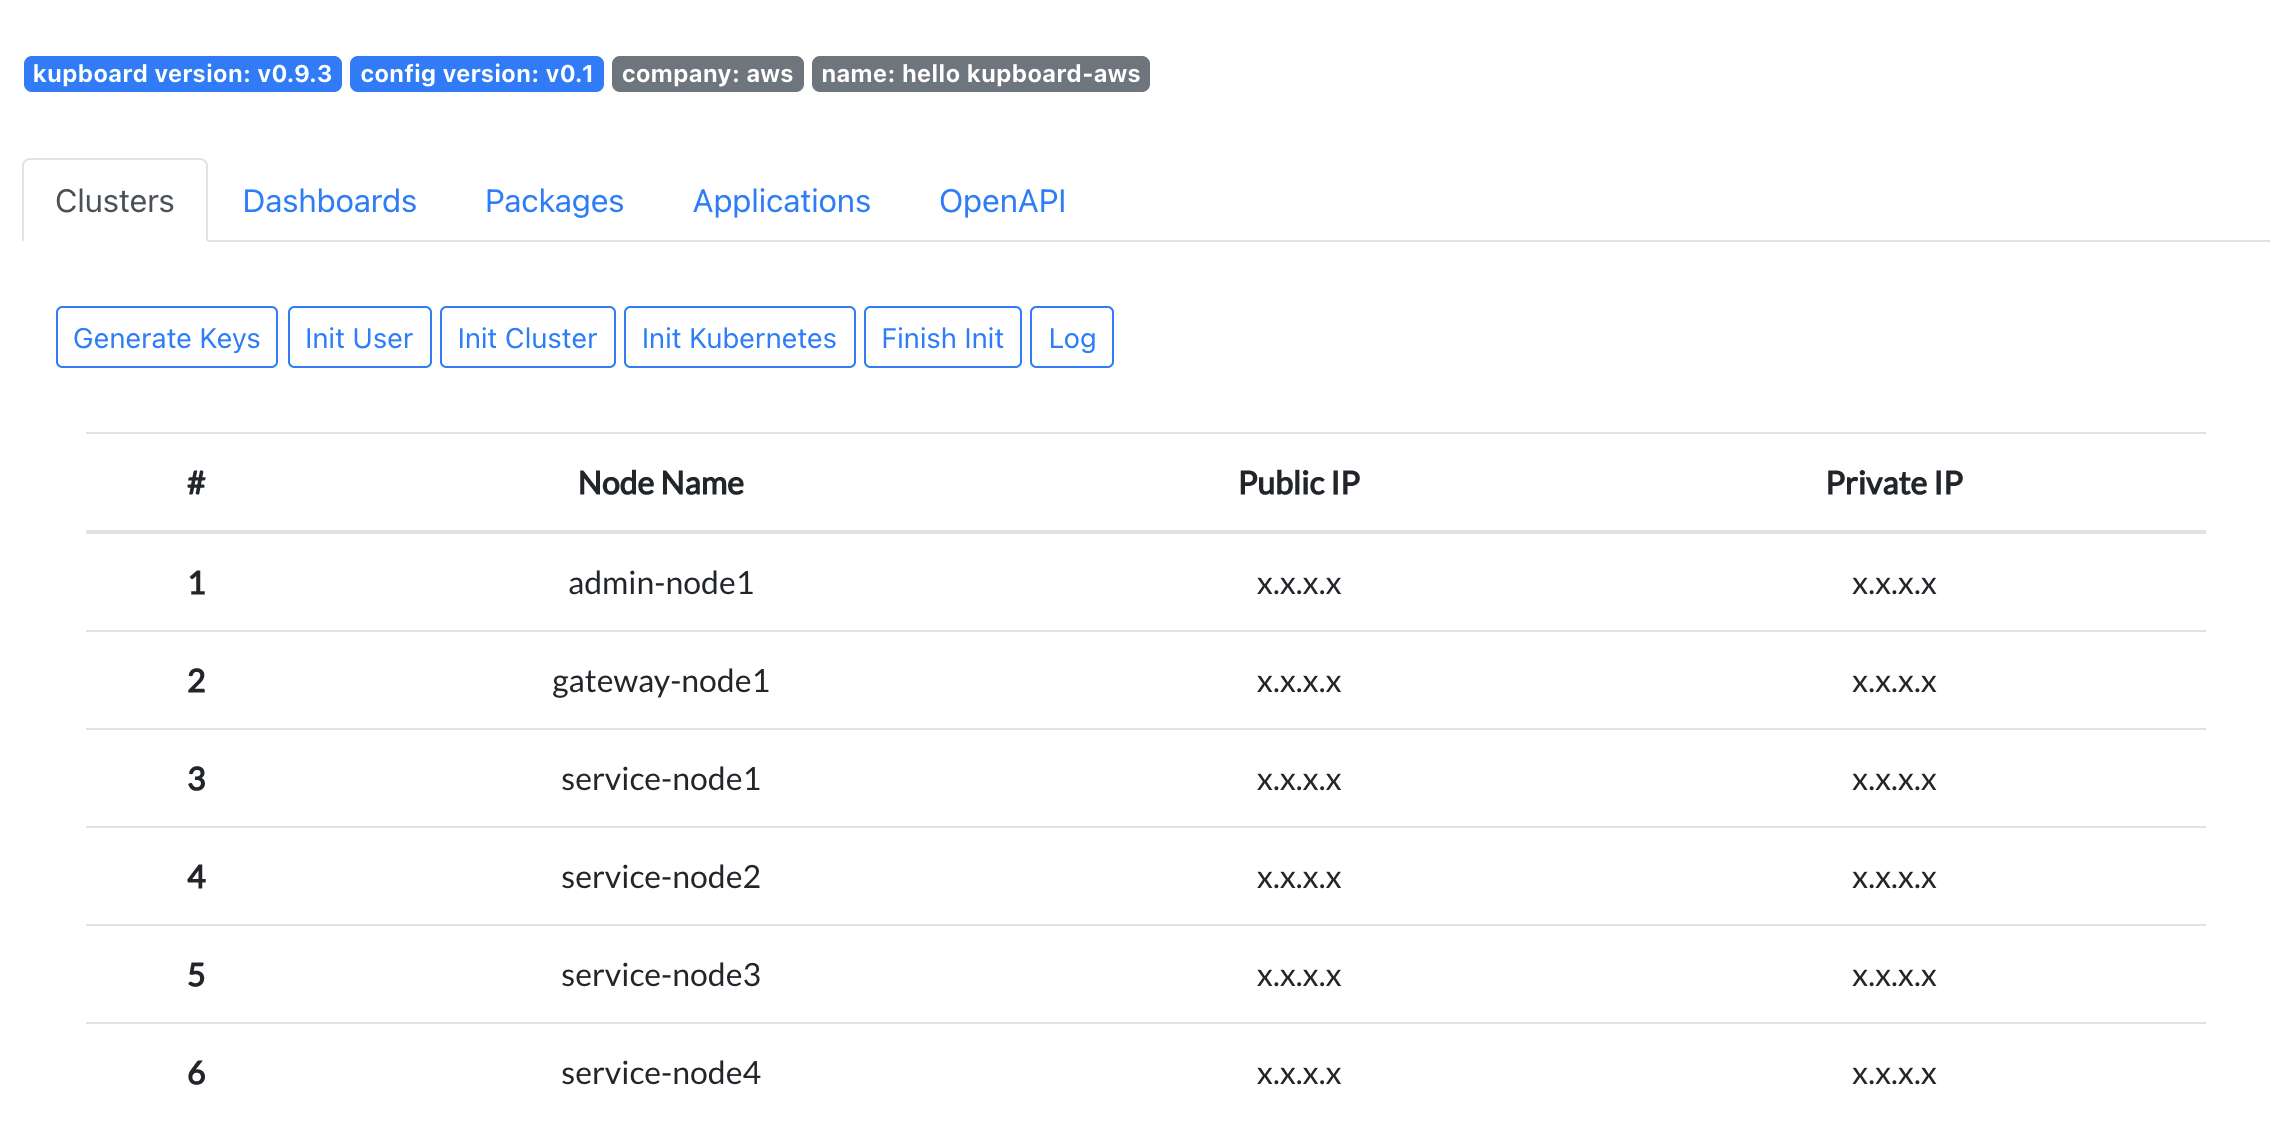
Cluster#
Cluster tab shows the cluster information defined in kupboard.yaml. At the top of the table are buttons for executing initialization commands. Users can perform initializations by clicking the buttons corresponding to the Setup commands without using cli commands for initialization.
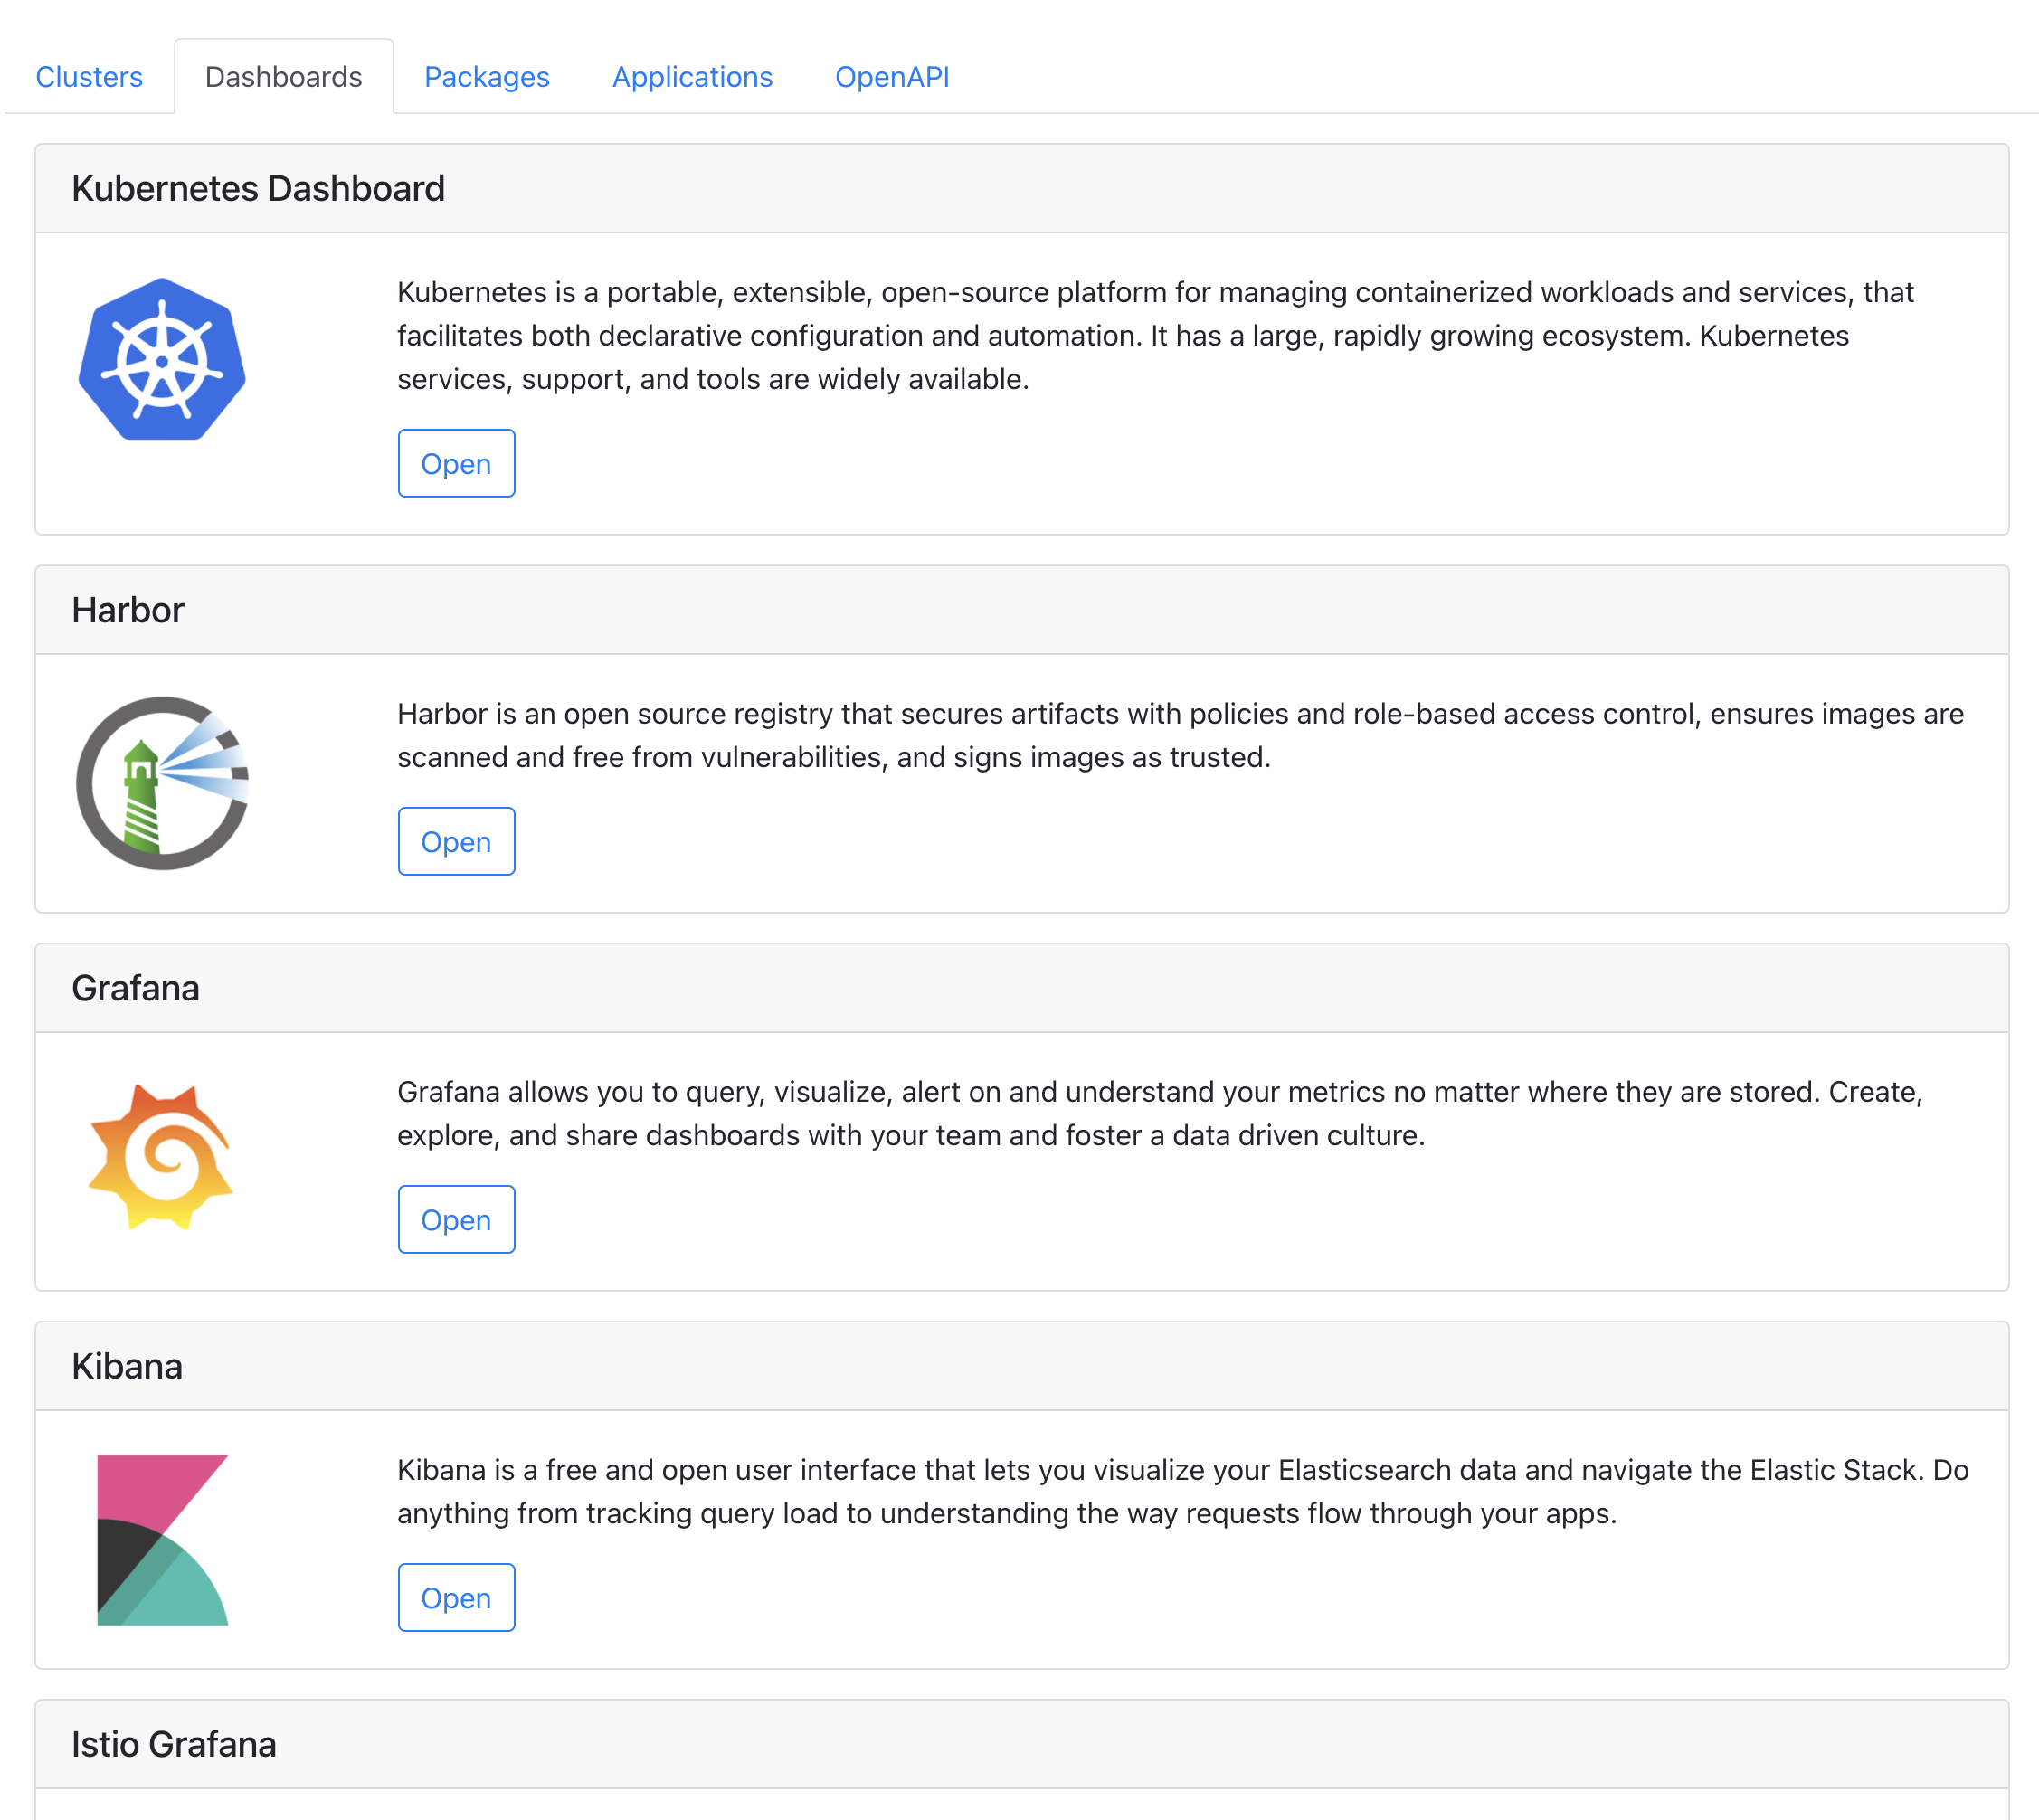
Dashboards#
Dashboards tab shows the dashboards of various solutions installed through default kollection, including Kubernetes Dashboard.
To access each dashboard, you must first bind two ports 443 and 8091 when you run the Kupboard Console.
Then, you need to add the following domains on DNS system or edit /etc/hosts to add the following items. This is because each dashboard cannot be accessed directly over the external Internet and it’s only allowed from the 443 and 8091 ports of the Kupboard Console.
To access the dashboard, you must first install the nginx-console of the default kollection, and if you have trouble in accessing despite installing nginx-console, run the connection action of dashboard proxy and console proxy and then try it again.
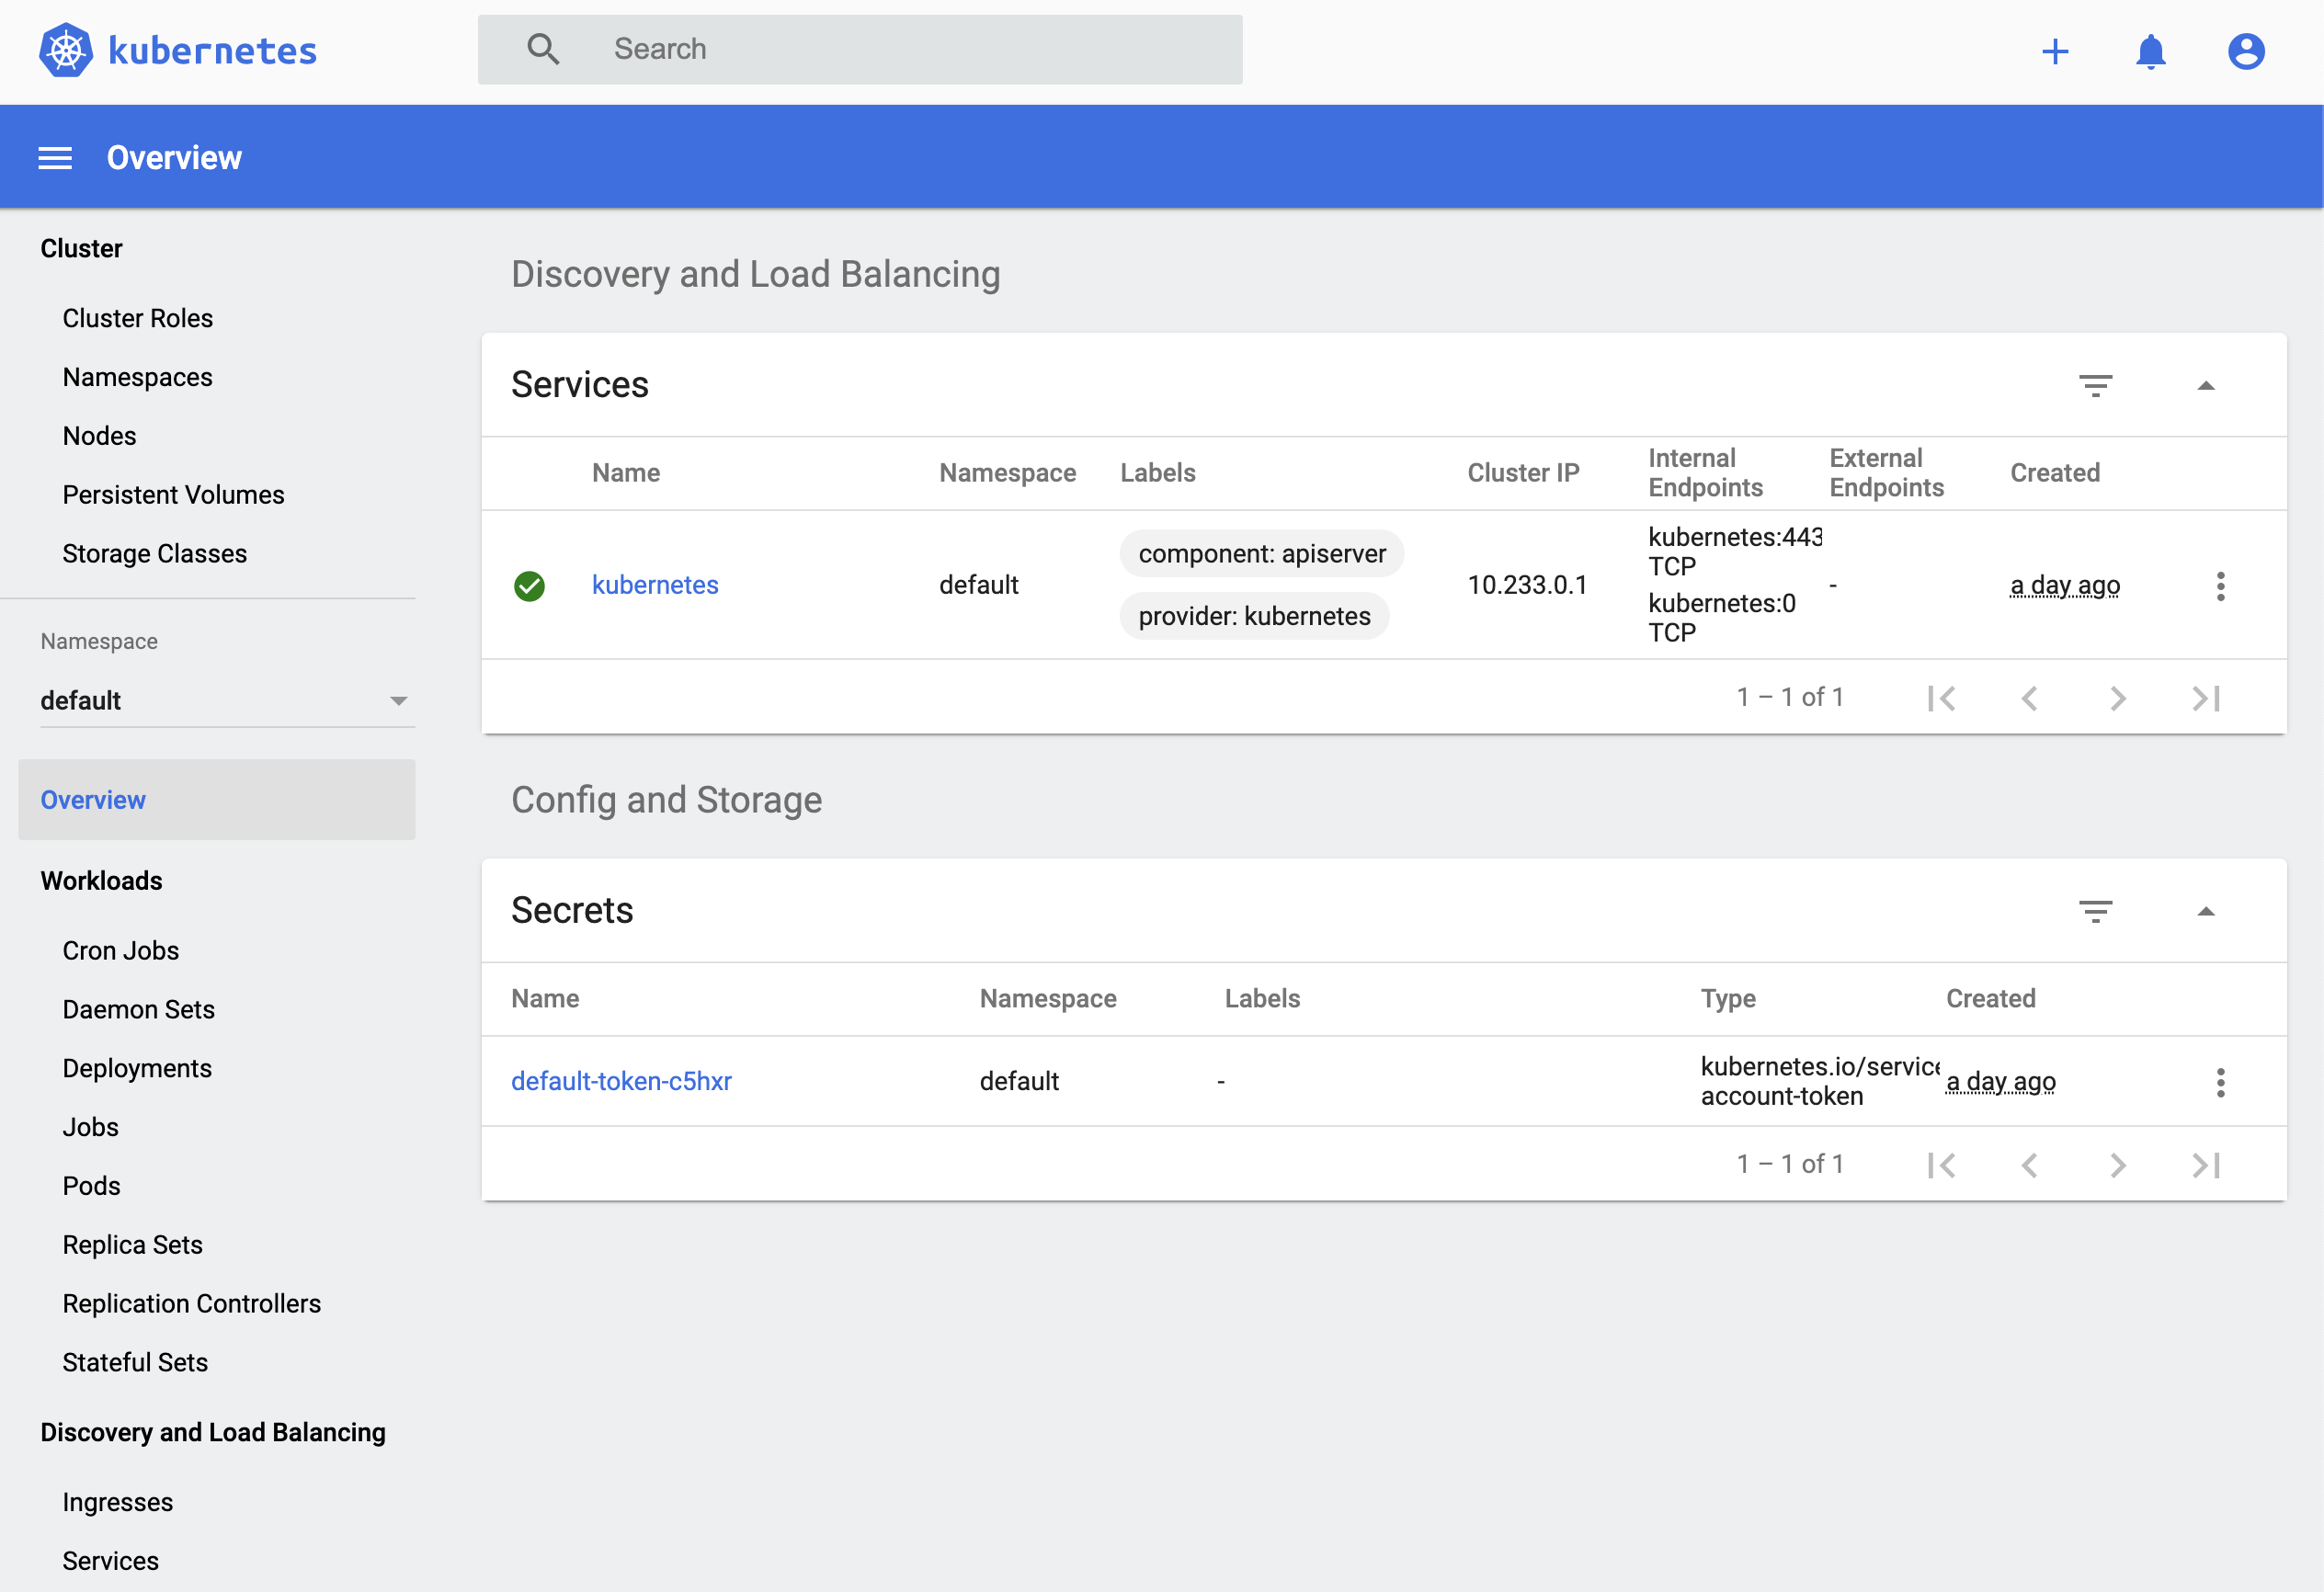
Example: Kubernetes Dashboard
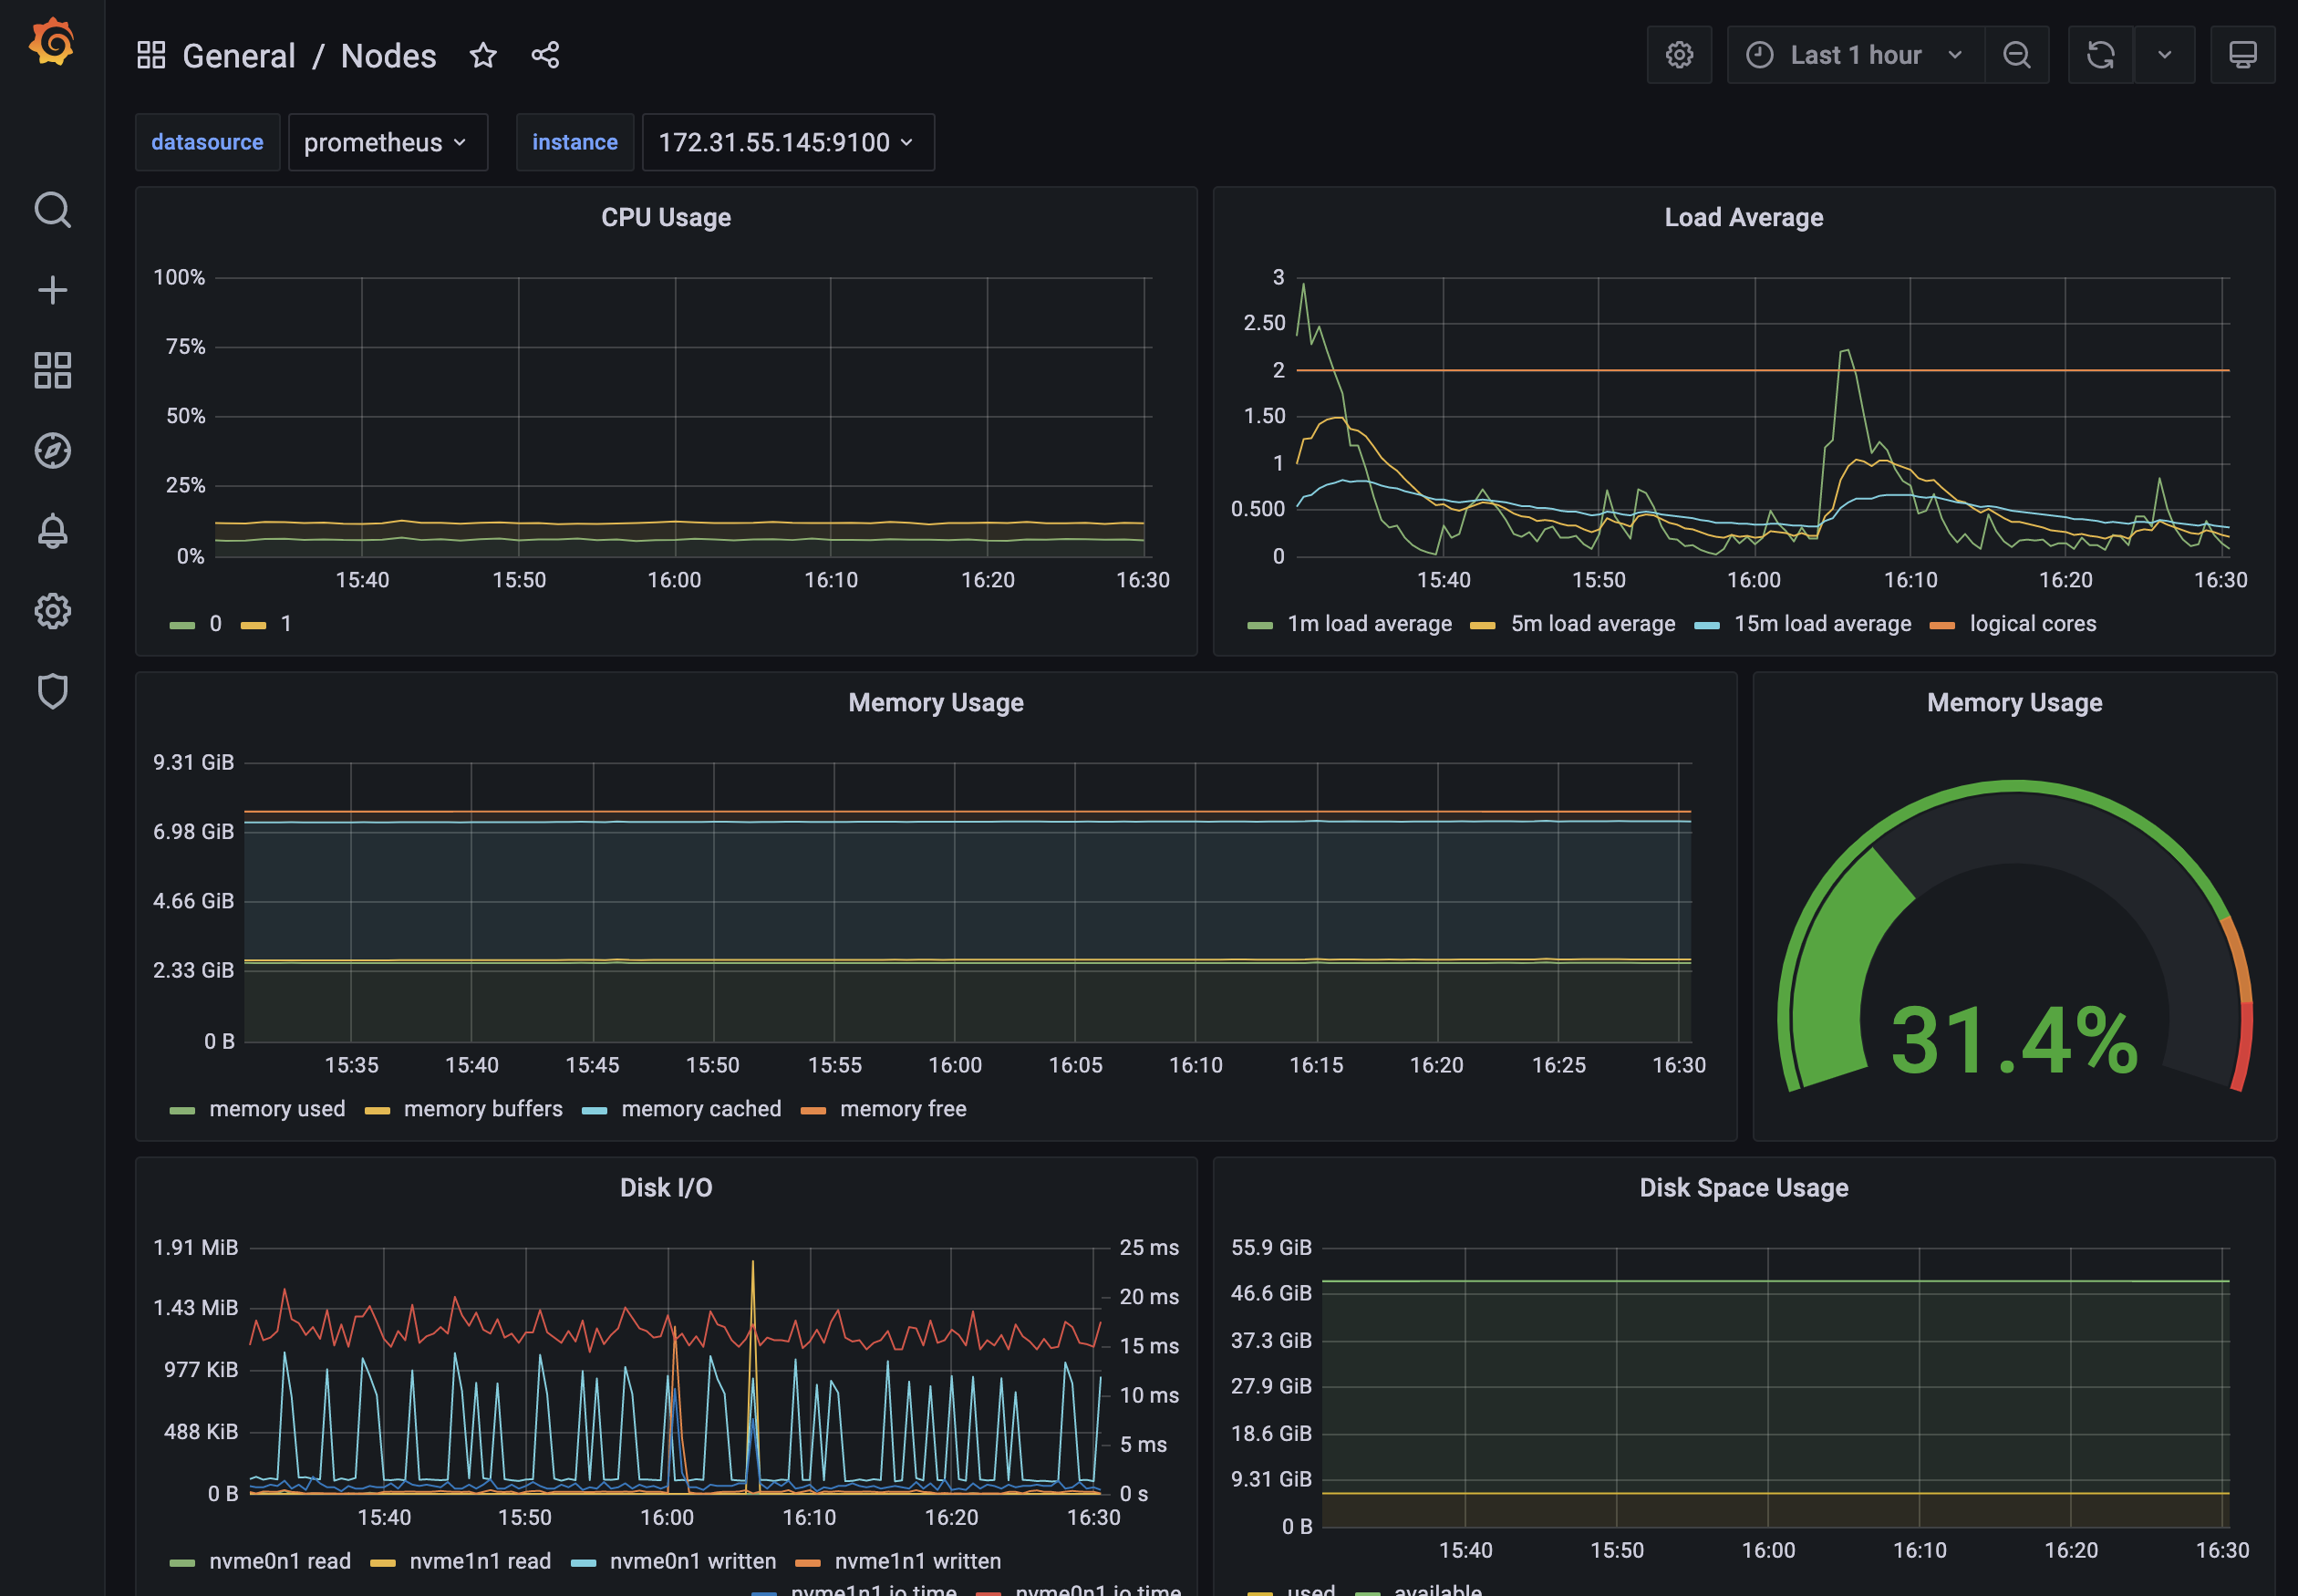
Example: Grafana
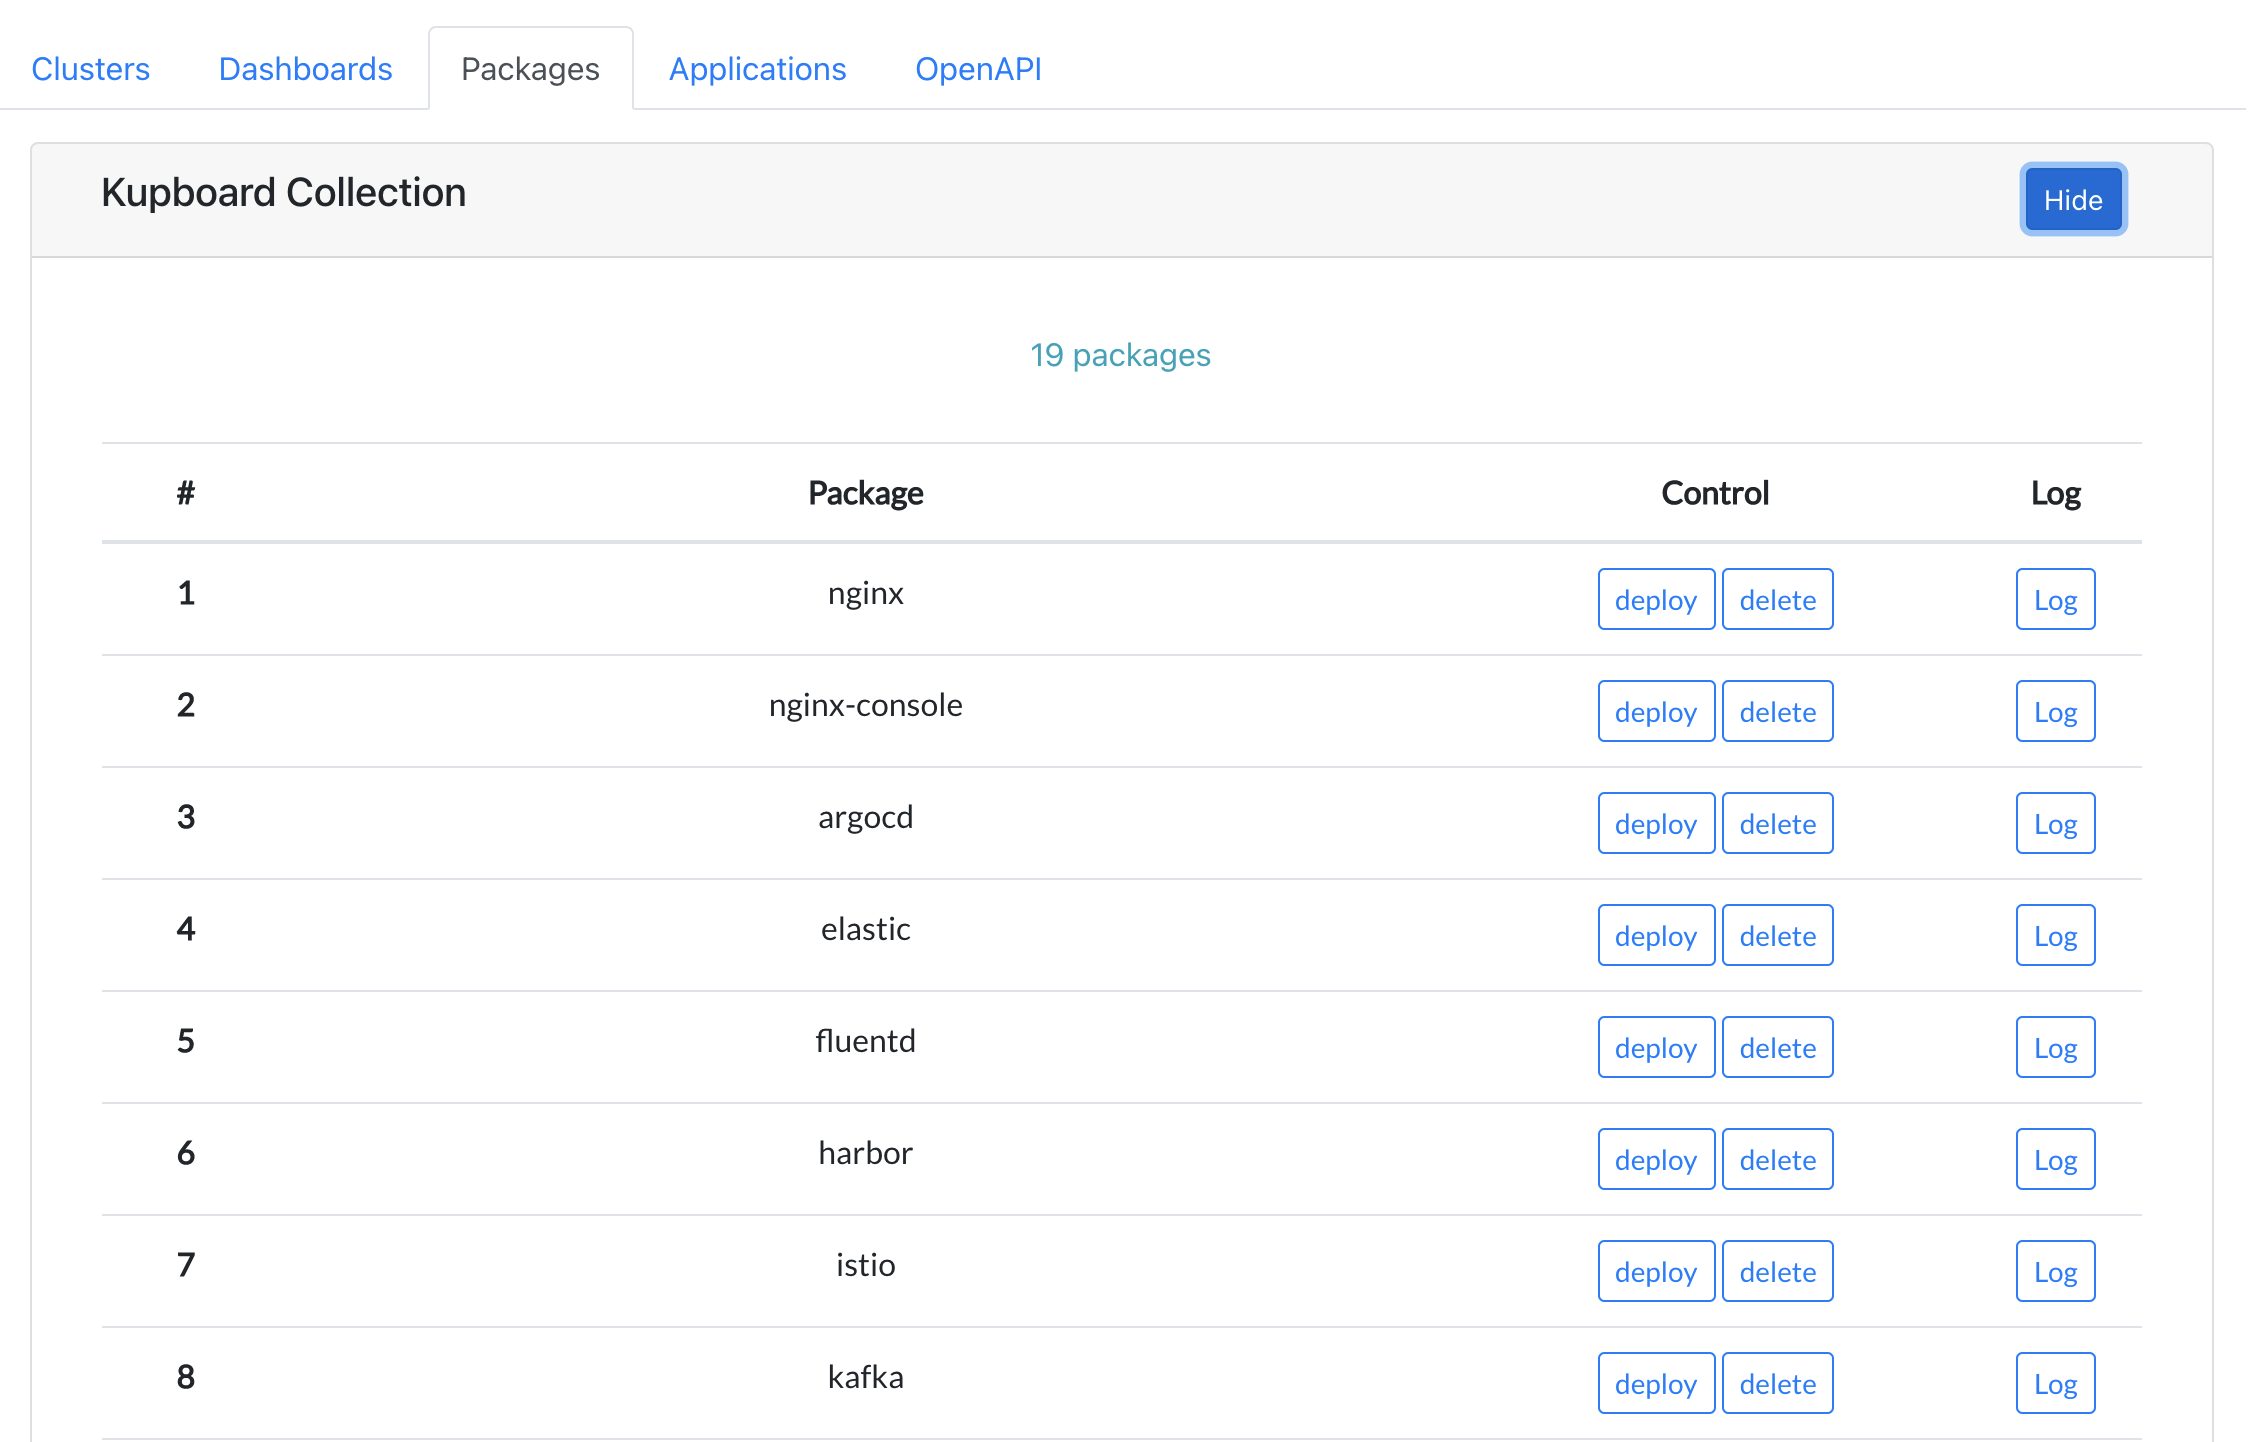
Packages#
Packages tab lists the package of kollections added to the data/kollection as well as the package of the default kollection, and can execute the actions provided by each package.
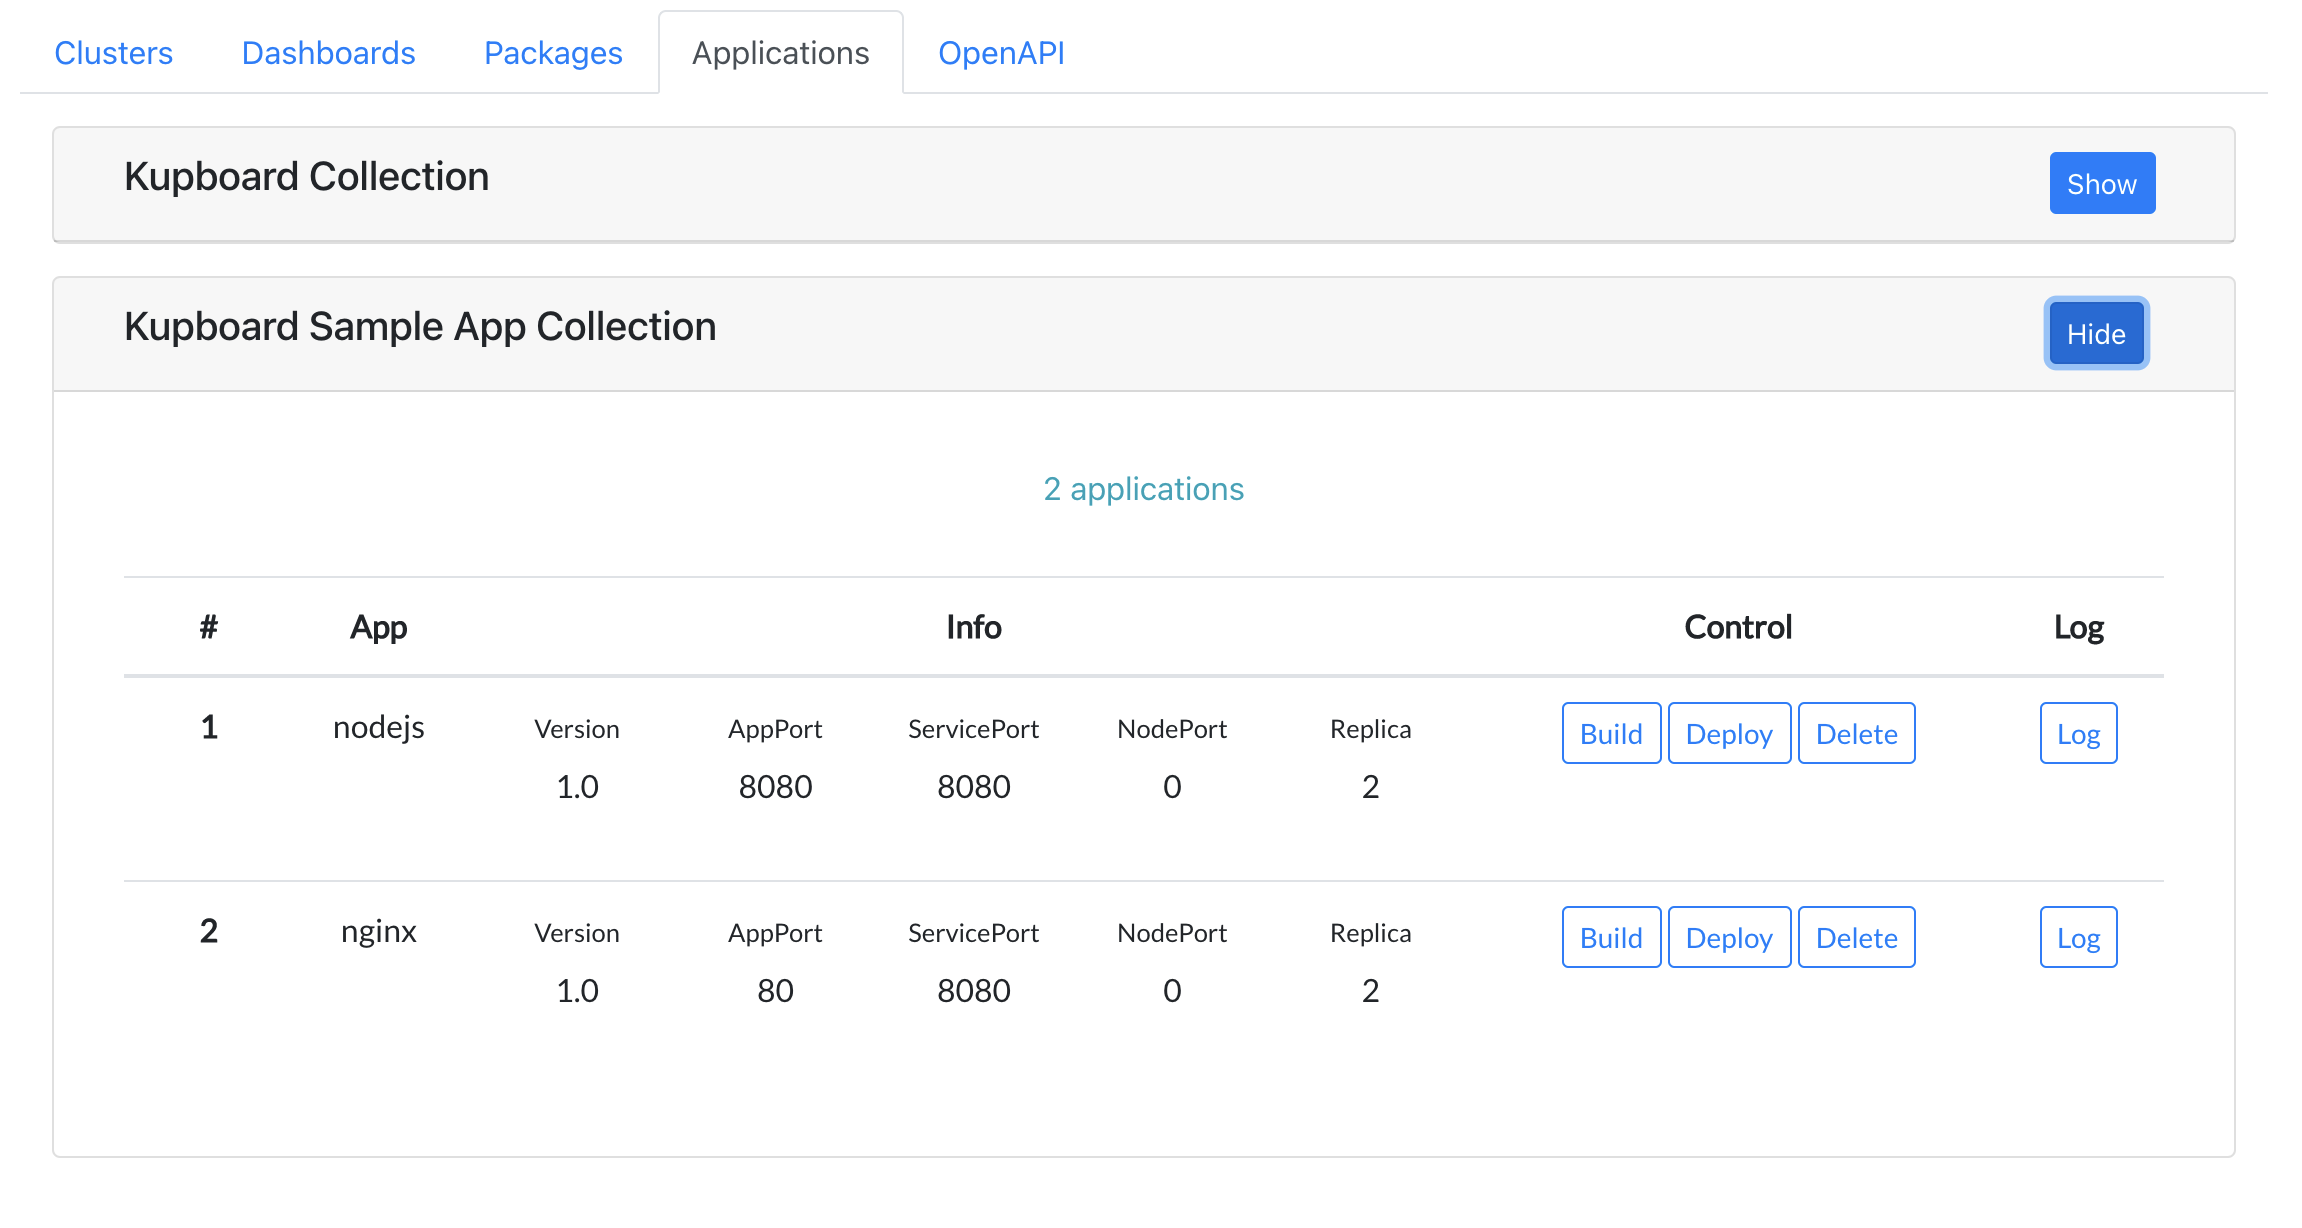
Applications#
Applications tab lists the applications that are included in the kollection added to the data/kollection, and allow users execute commands to build/apply/delete application.
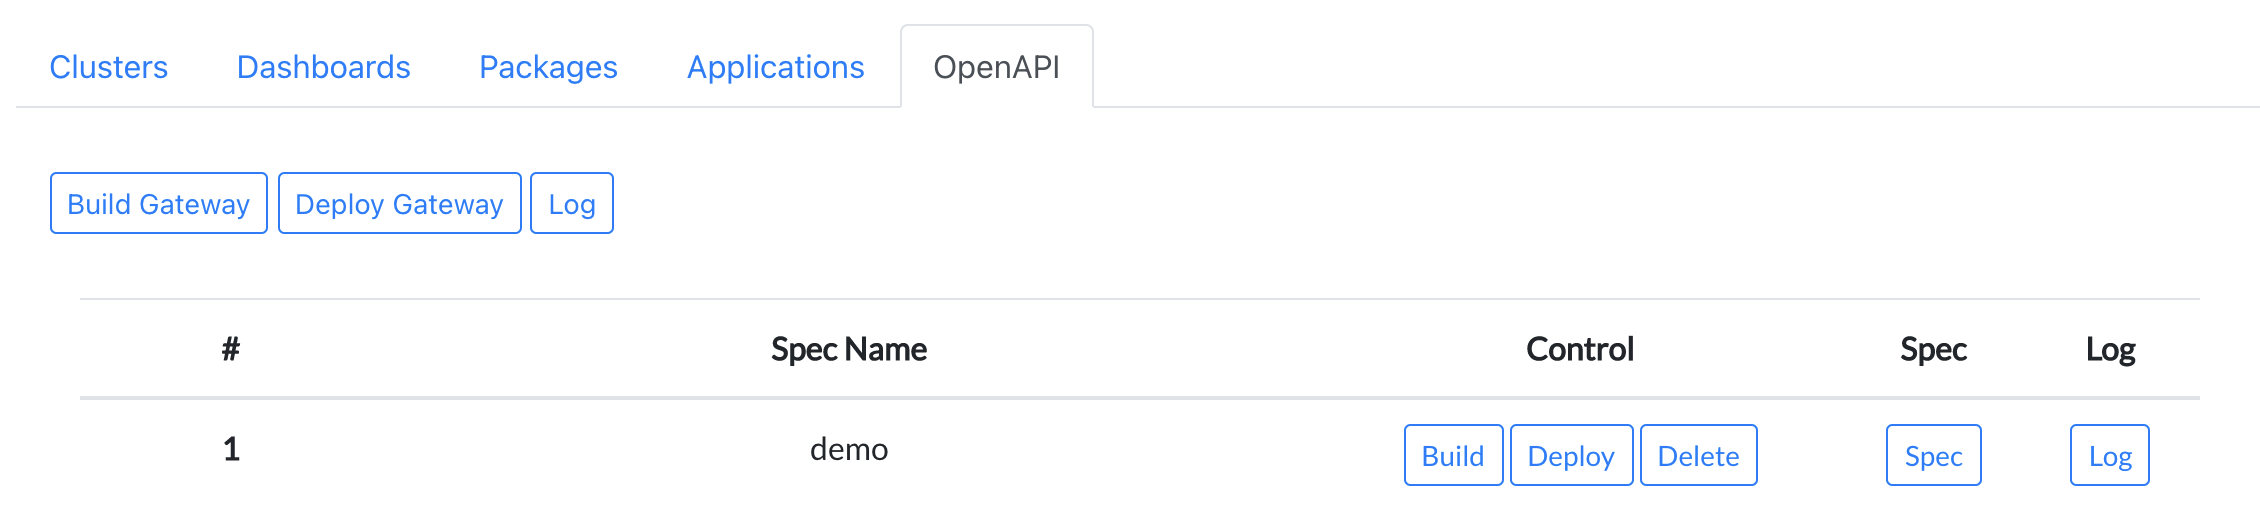
OpenAPI#
OpenAPI tab lists the openapi specifications included in the data/api and allows build/deploy/delete just like the application.