Monitoring & Scaling
Monitoring resources is critical to maintain a stable system, and humans need to be aware of specific system status. In addition to monitoring, services on cloud native should be resilient and scalable. Clusters of kupboard are very flexible and its size can be changed manually or automatically.
Monitoring#
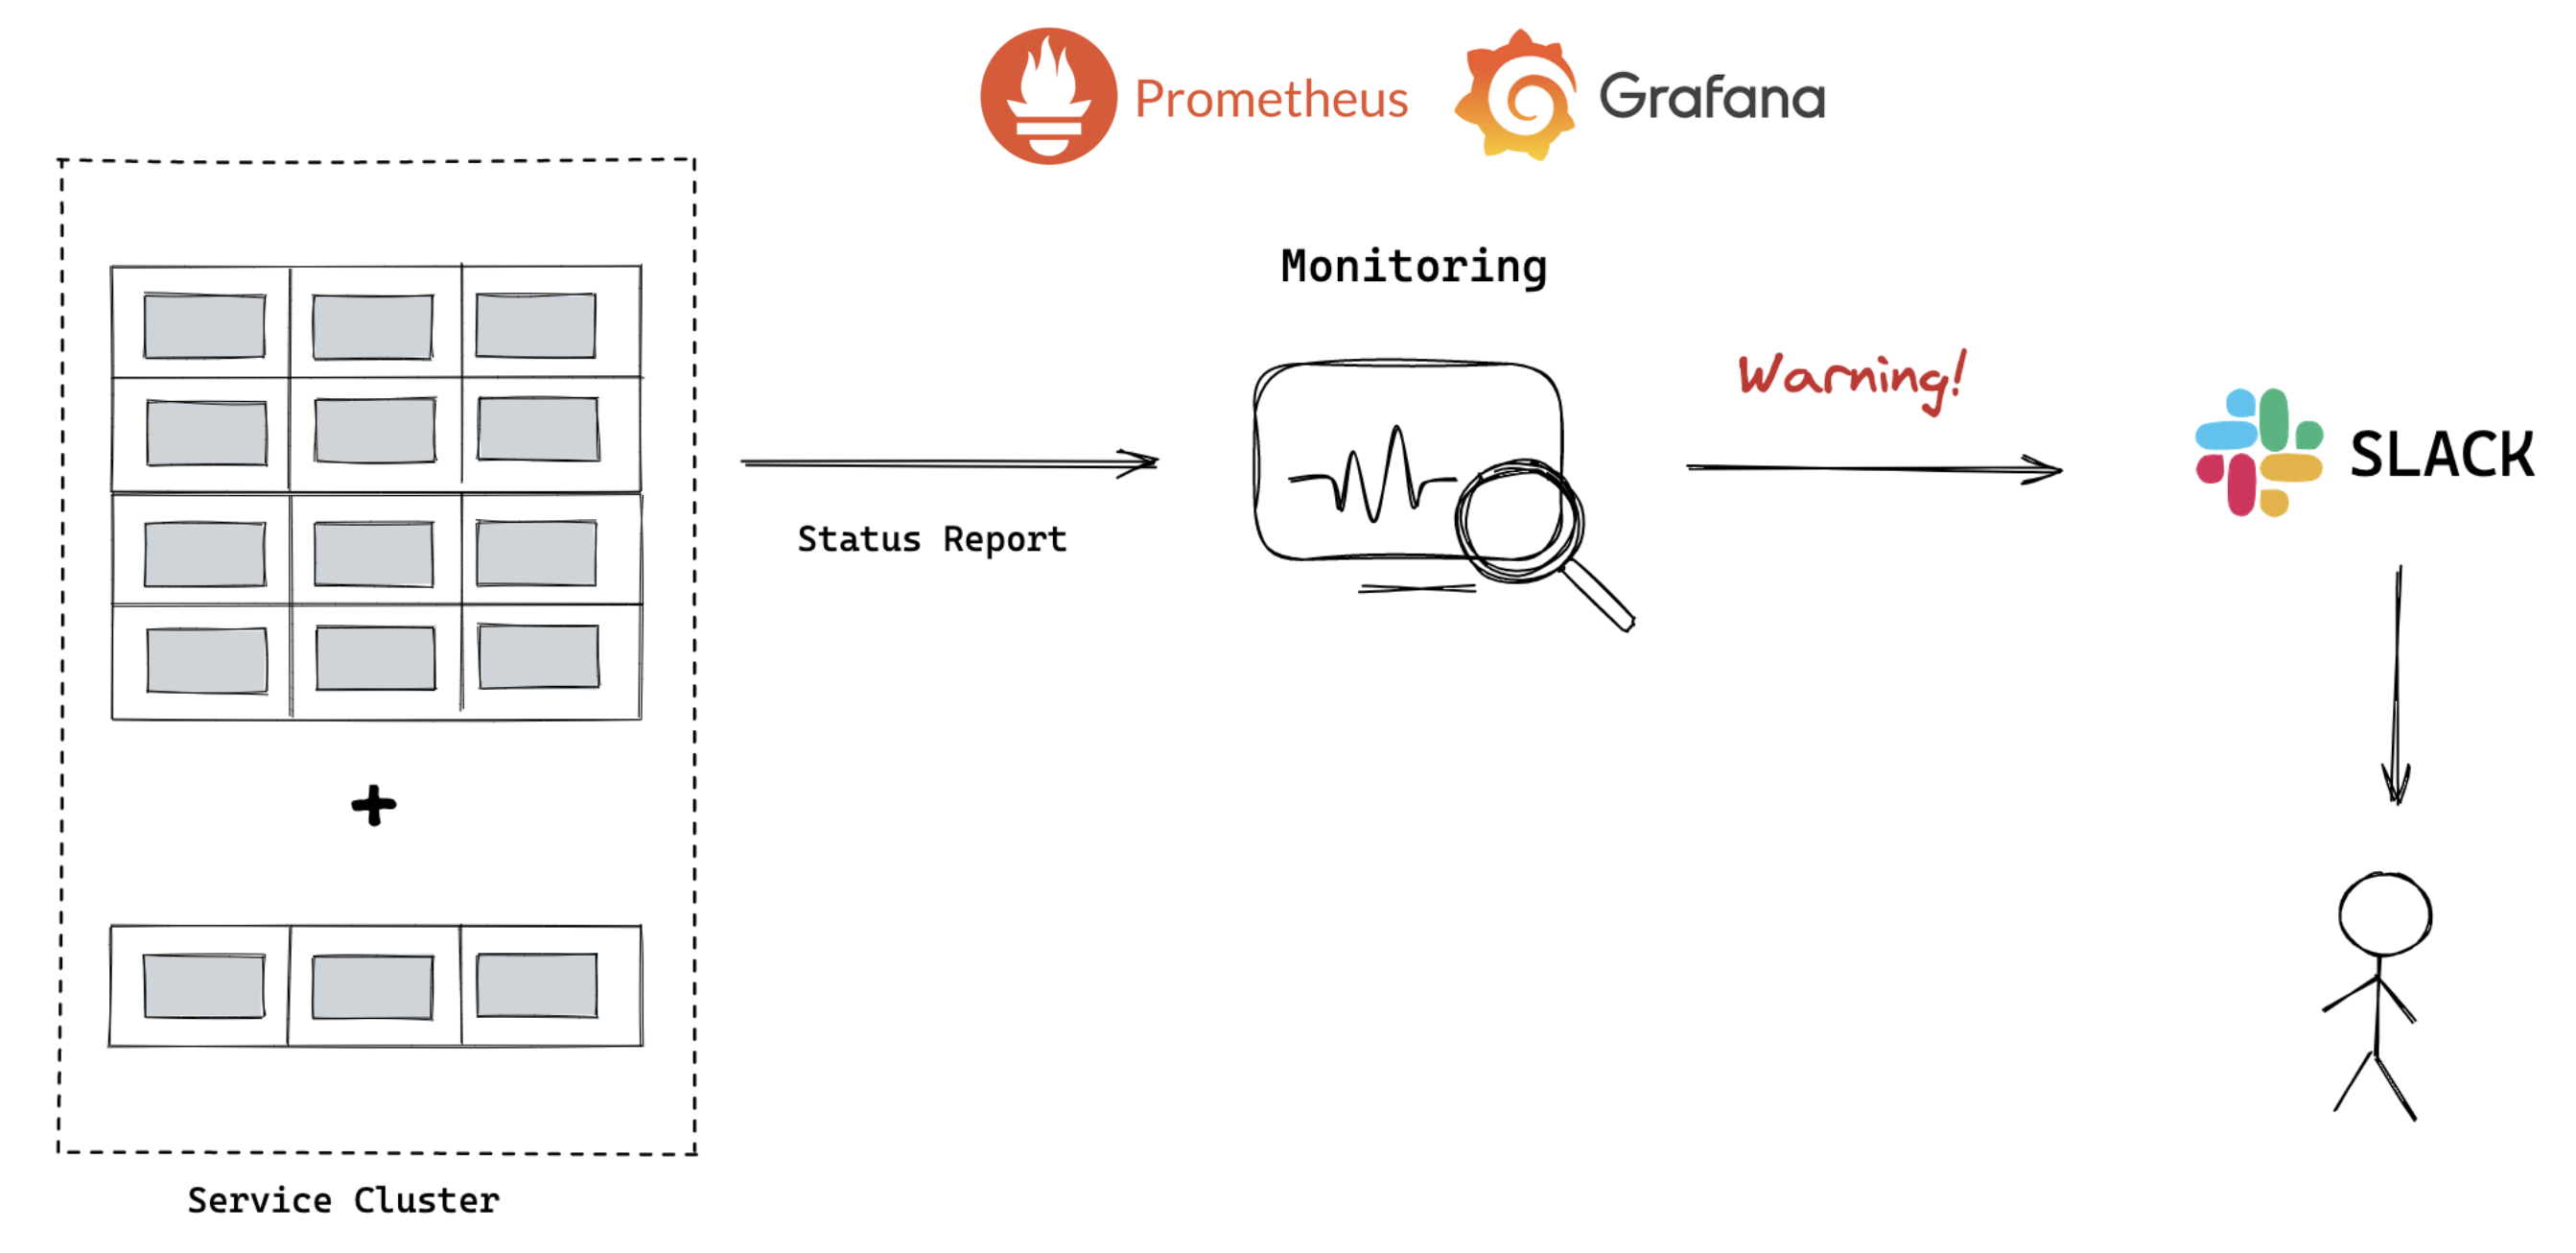
Kupboard supports the resource monitoring using Prometheus and Grafana and they send notifications through a variety of ways such as Slack, Discord and email. In this way humans can recognize resource status and plan to handle specific situations.
Scaling#
Cluster scaling is important for many reasons. If you can change the size of the cluster, it is very useful in many situations. You can prepare for some big events by increasing the size of the cluster or we can reduce the size of cluster when the resource utilization is less than we expected.
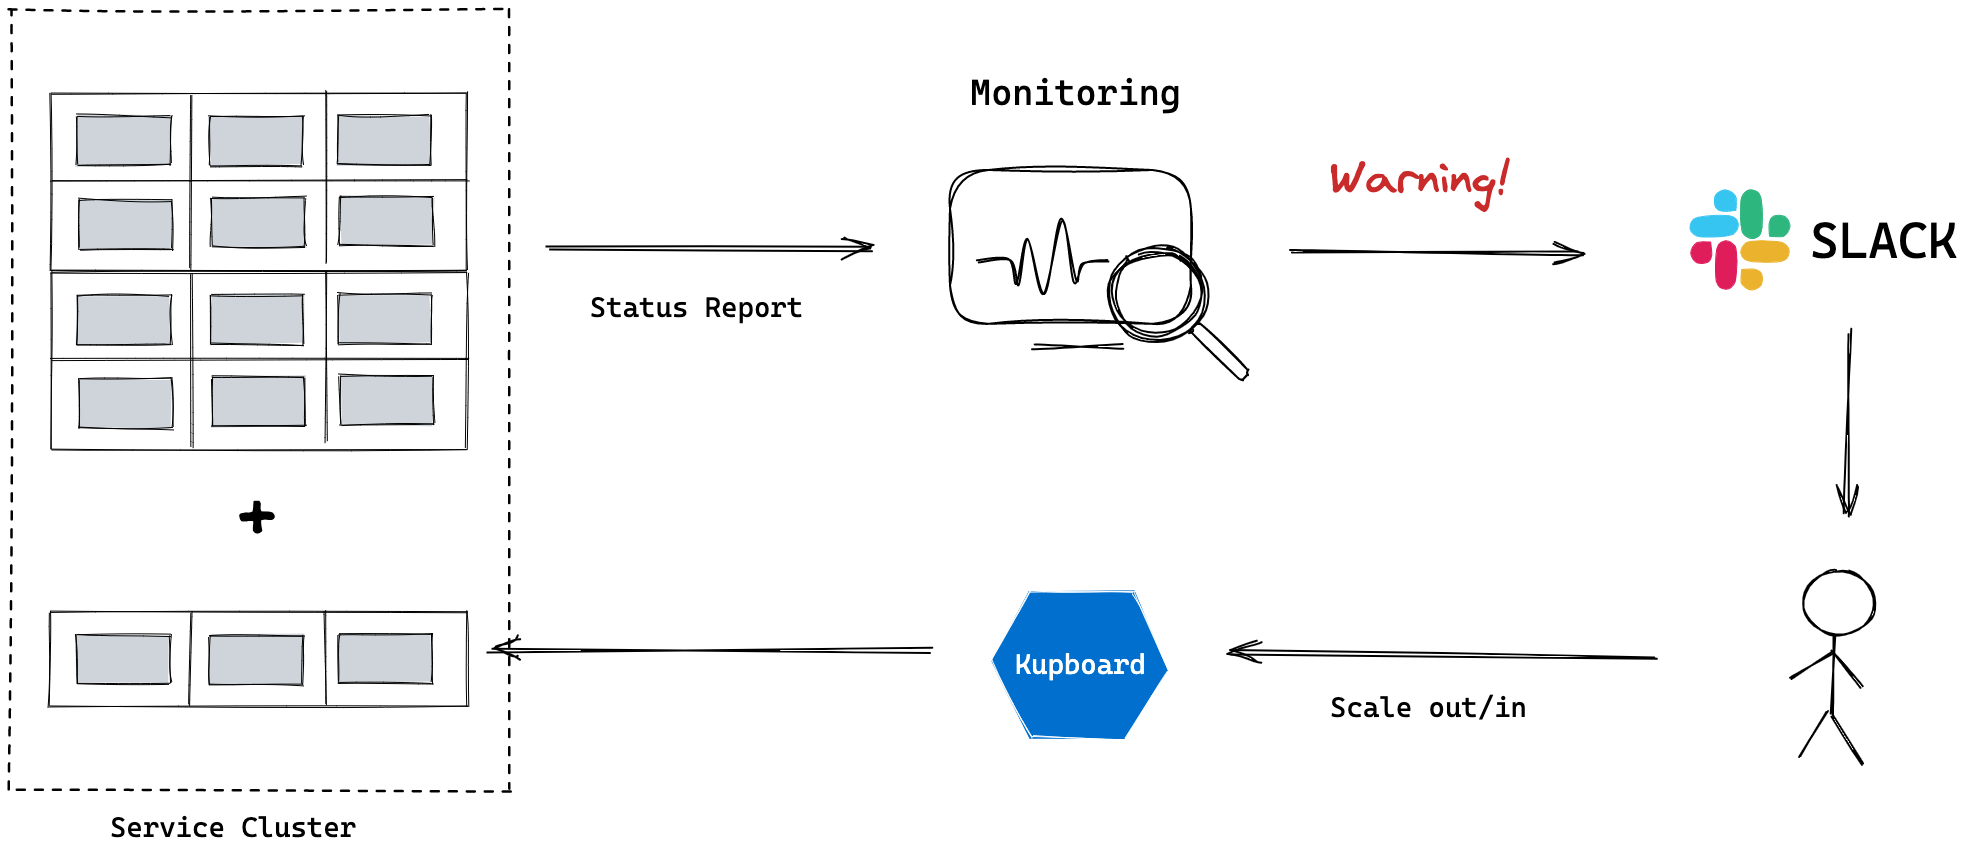
Manual Scaling#
A user decides to increase or decrease the size of cluster based on the resouce status. You can easily do this by running kupboard's cluster command like below. Please see here for more information about Cluster Command.
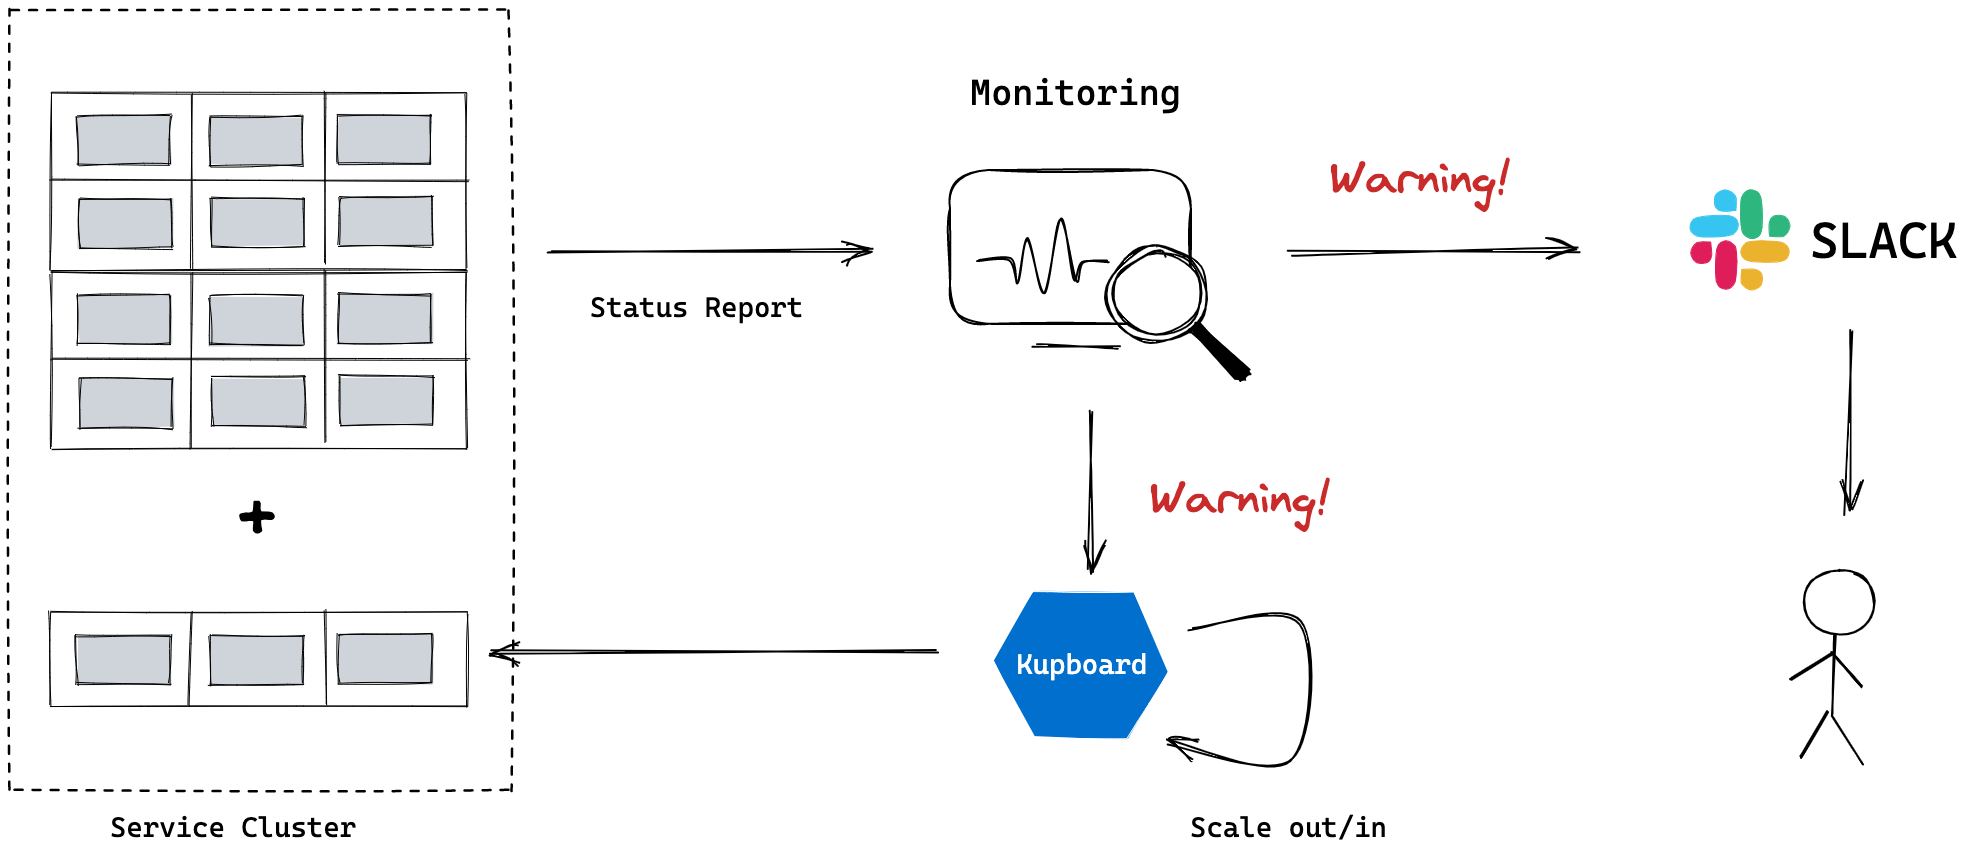
Auto Scaling#
Kupboard's auto-scaling module evaluates metric from resource monitoring and automatically performs scaling by adding a new node or removing an existing node.